
Rodent Inspections | ARCHIVE

This started as a project for my postgrad at Columbia — but turned out to be rather interesting.
The Apriori algorithm, more commonly referred to as ‘market basket analysis’, is a data mining technique that uncovers meaningful correlations between different entities according to their co-occurrence in a data set. Consider this example:
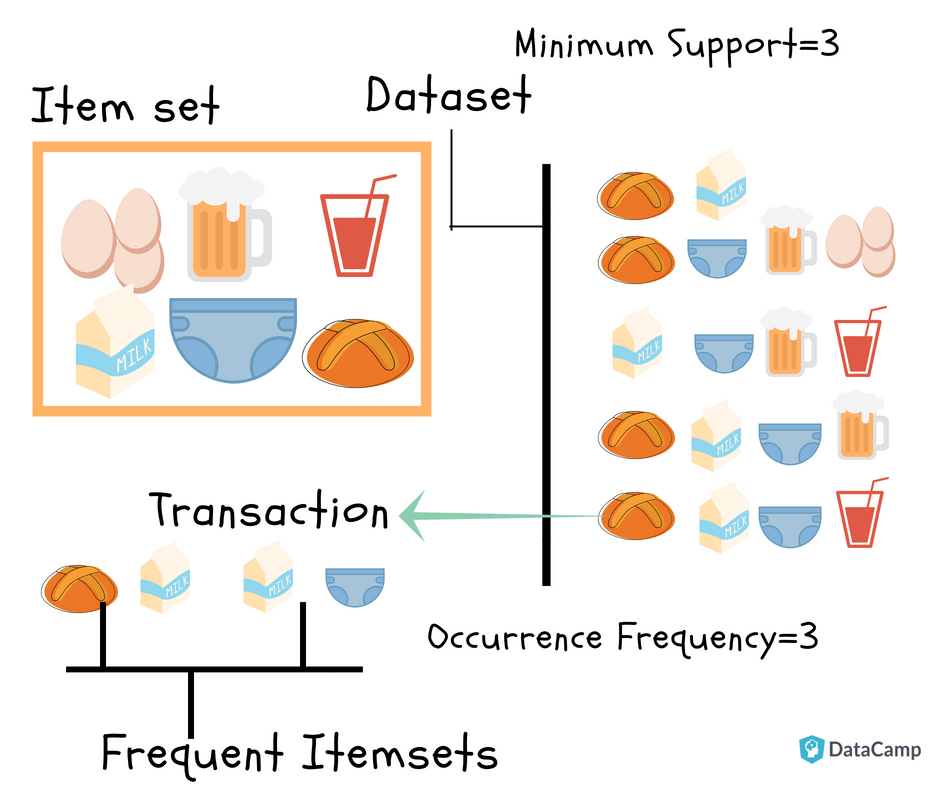
A supermarket had five distinct “transactions” on a given day. Five customers, each purchasing a variety of items (bread, milk, diapers, etc). The Apriori algorithm iterates through these five transactions and looks for commonality. The commonality that this algorithm identifies is twofold:
Find items that are purchased frequently
(the supermarket sells a lot of bread)
Find items that are purchased frequently together
(when people buy bread, they often buy milk and diapers as well)
My partner and I were tasked with implementing this algorithm on a dataset of our choosing from the many which exist on New York City’s OpenData platform. We eventually settled on the rodent inspection dataset. Now, I know you’re skeptical, but hear me out.
Rodent inspection data is indicative of health code standards in the NYC metropolitan area. Which businesses in New York are scheduling routine rodent inspections as a matter of compliance? Which are requesting bait to be laid? Are certain boroughs experiencing more rat activity than others? What do these locations have in common?
Consider the following results:
{ zipcode, neighborhood, borough, street name }
---------------------------------------------------------------------
{10009, 'East Village', 'Manhattan', 'EAST 9 STREET'} => Rat Activity

{'East Village', 'Manhattan'} => Rat Activity

{10009, 'Manhattan'} => Rat Activity

{10009, 'East Village'} => Rat Activity

{'Queens'} => Rat Activity

{'Manhattan'} => Rat Activity
Our algorithm found generic relationships like:
{'Queens'} => Rat Activity (Conf: 33%)
{'Manhattan'} => Rat Activity (Conf: 33%)
This says that 33% of rodent inspections in Queens and Manhattan had reported rat activity (whereas the other 67% of inspections had none).
Our algorithm also found very specific relationships such as:
{10009, 'East Village', 'Manhattan', 'EAST 9 STREET'} => Rat Activity (Conf: 100%)This is saying—based on the millions of rodent inspections in New York City from 2014 through 2024—that with 100% confidence there was rat activity in Manhattan, zip code 10009, in the East Village neighborhood, and more specifically along East 9th Street.
And if we filter down the data to this street in New York, we can even see the specific house codes which failed their routine rodent inspections:
700 (this is a cocktail bar, with 4.6 stars on Google reviews): https://maps.app.goo.gl/rRJL3fY6UNULpiKCA
710 (the local food bank, which is mildly concerning): https://maps.app.goo.gl/X9p8MwdiXA93vDis5
424 (an art gallery which has failed their mandatory rodent inspection several years running): https://maps.app.goo.gl/TYpXheixSzjn51626
We used market basket analysis to find similarities across rodent inspections in New York City over the past 10 years which serves as an interesting (as well as frightening) proxy to determining its most rat infested neighborhoods.